
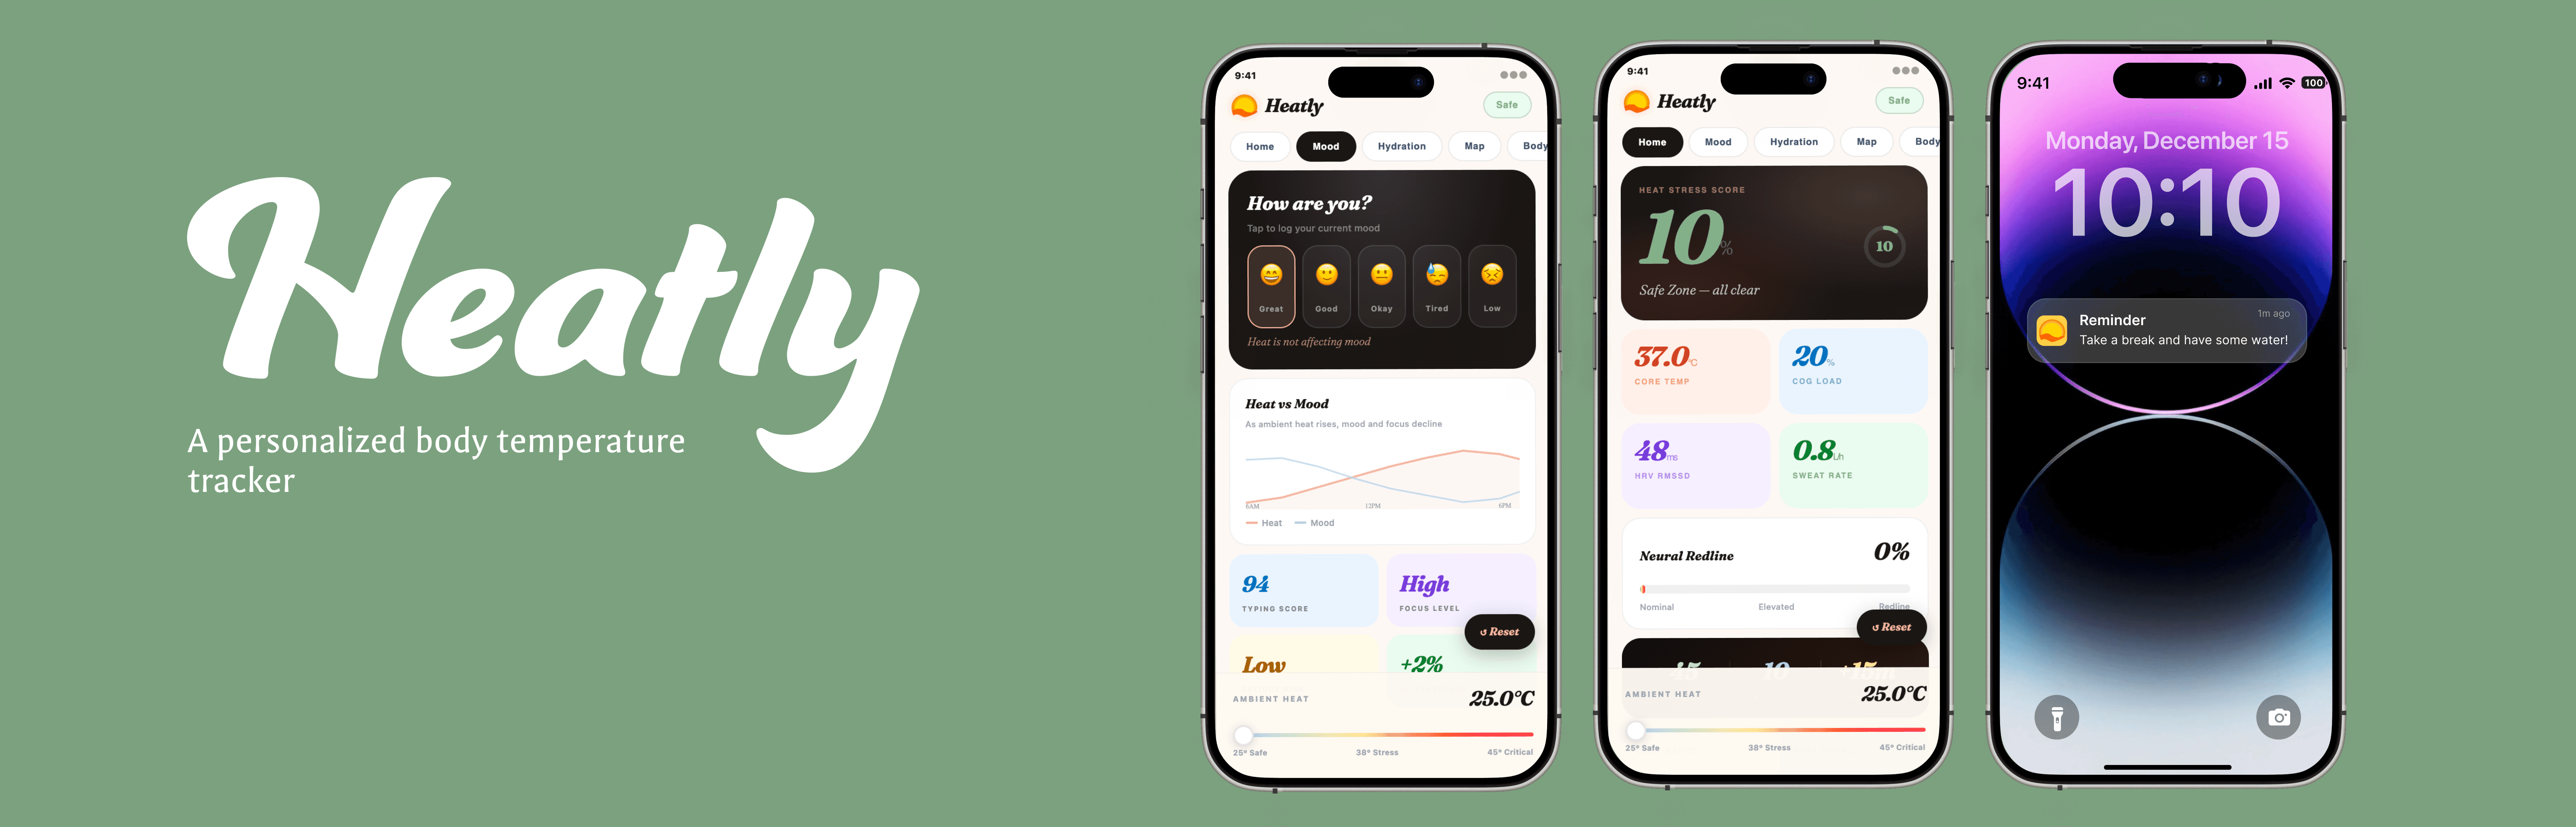
Role
UX/UI Designer
Tools
Figma, Illustrator
PROBLEM
Signals of Heat Stroke were caught too late.
The prompt for FigBuild 2026 was to create a speculative tool that quantifies previously unmeasurable human sensory experiences. Thinking back to my dad, I would watch him work outside long hours in the heat. The longer he stayed out, the more the heat took a toll on his body.
Our team chose to focus on thermal regulation to help regulate the bodies of workers in extreme weather.
SOLUTION
Visibility & Measurement
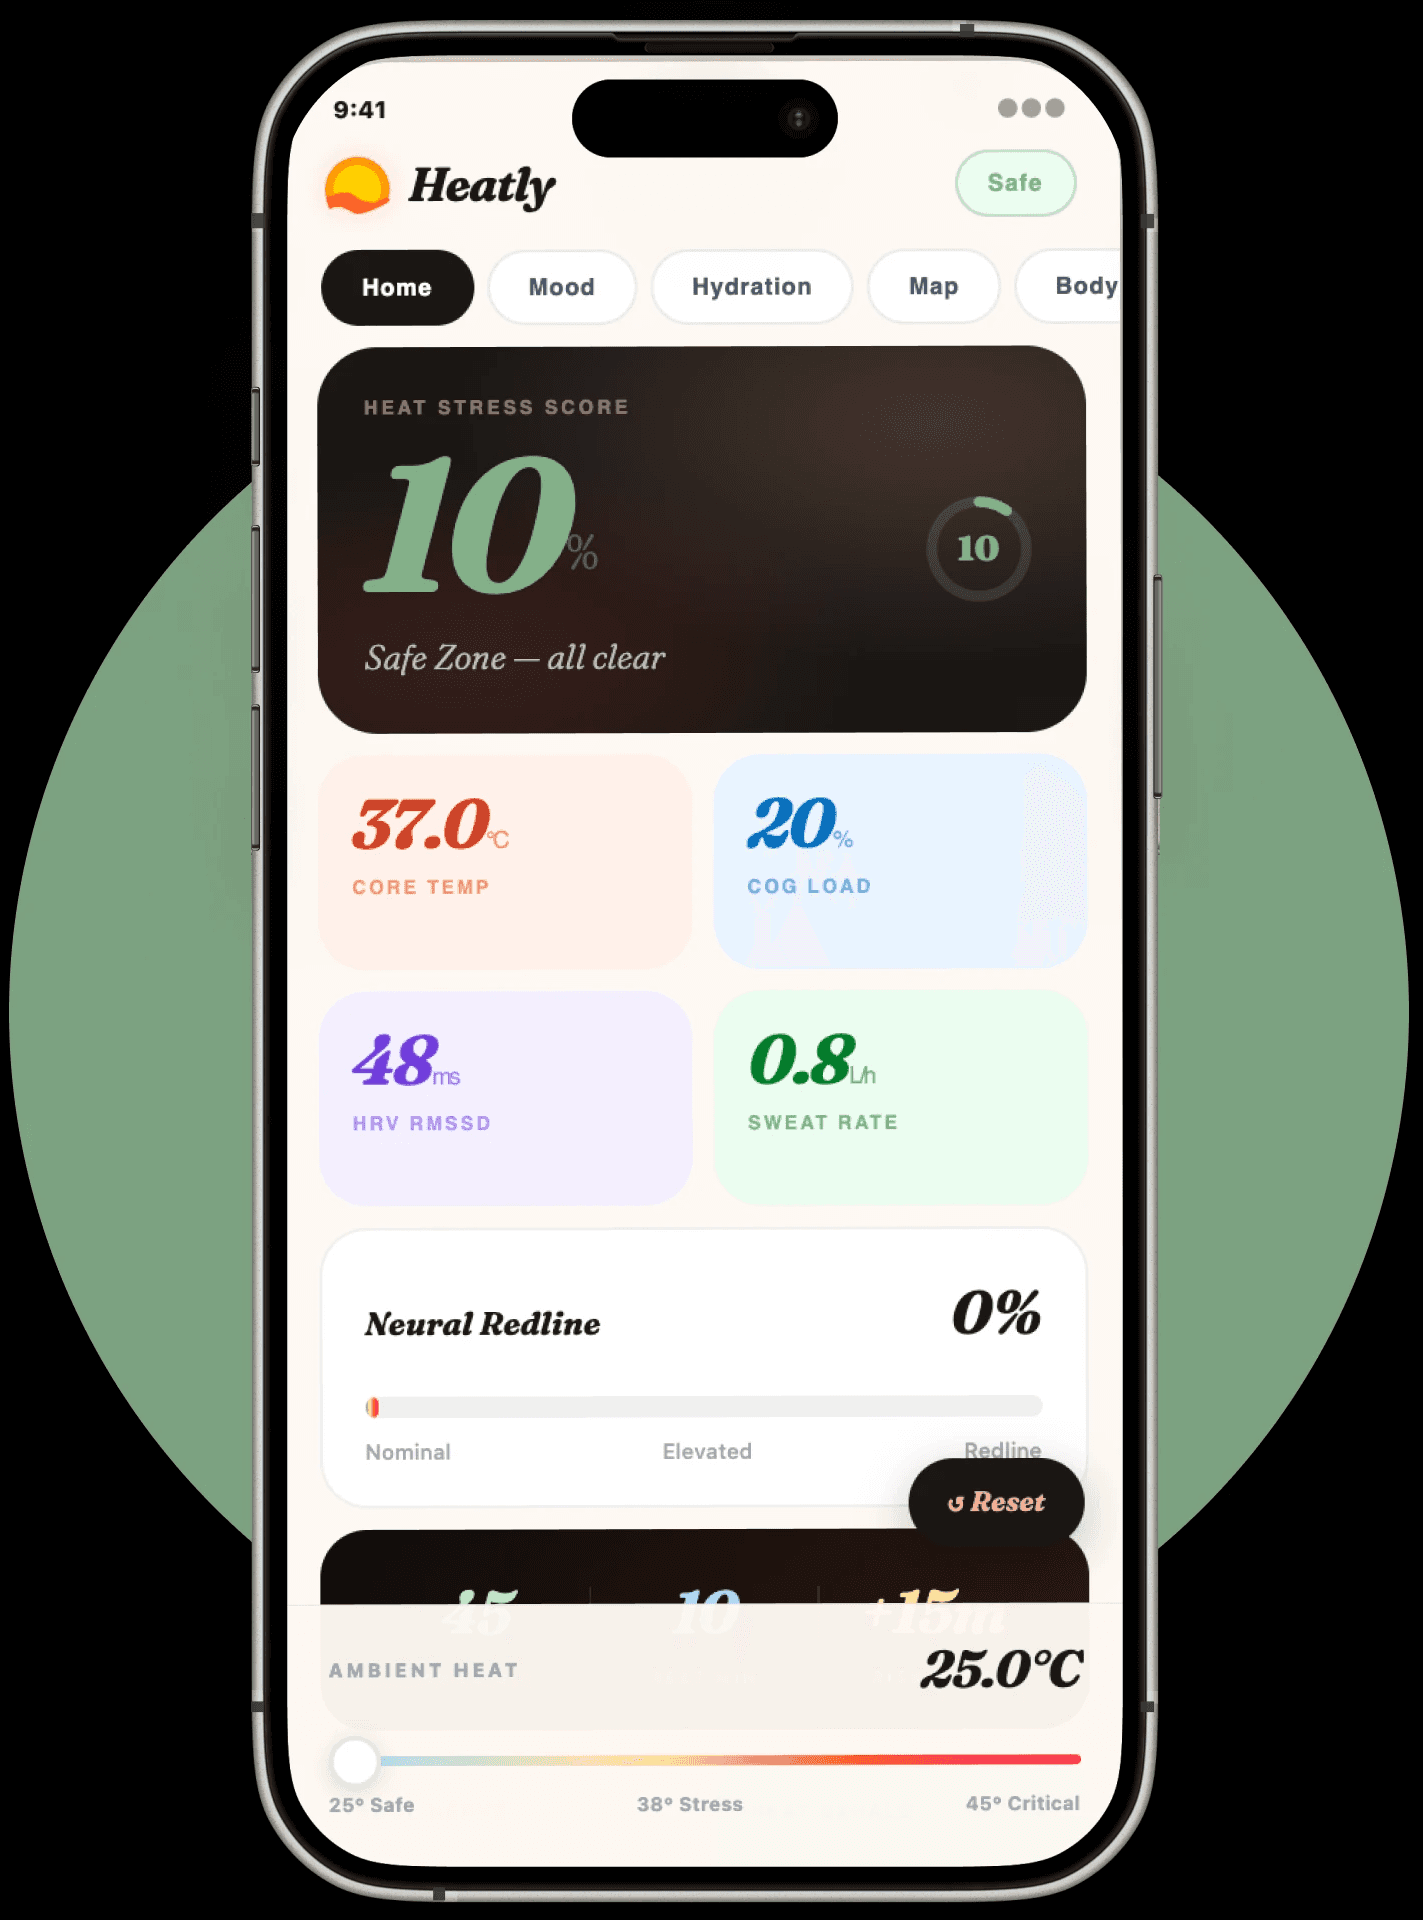
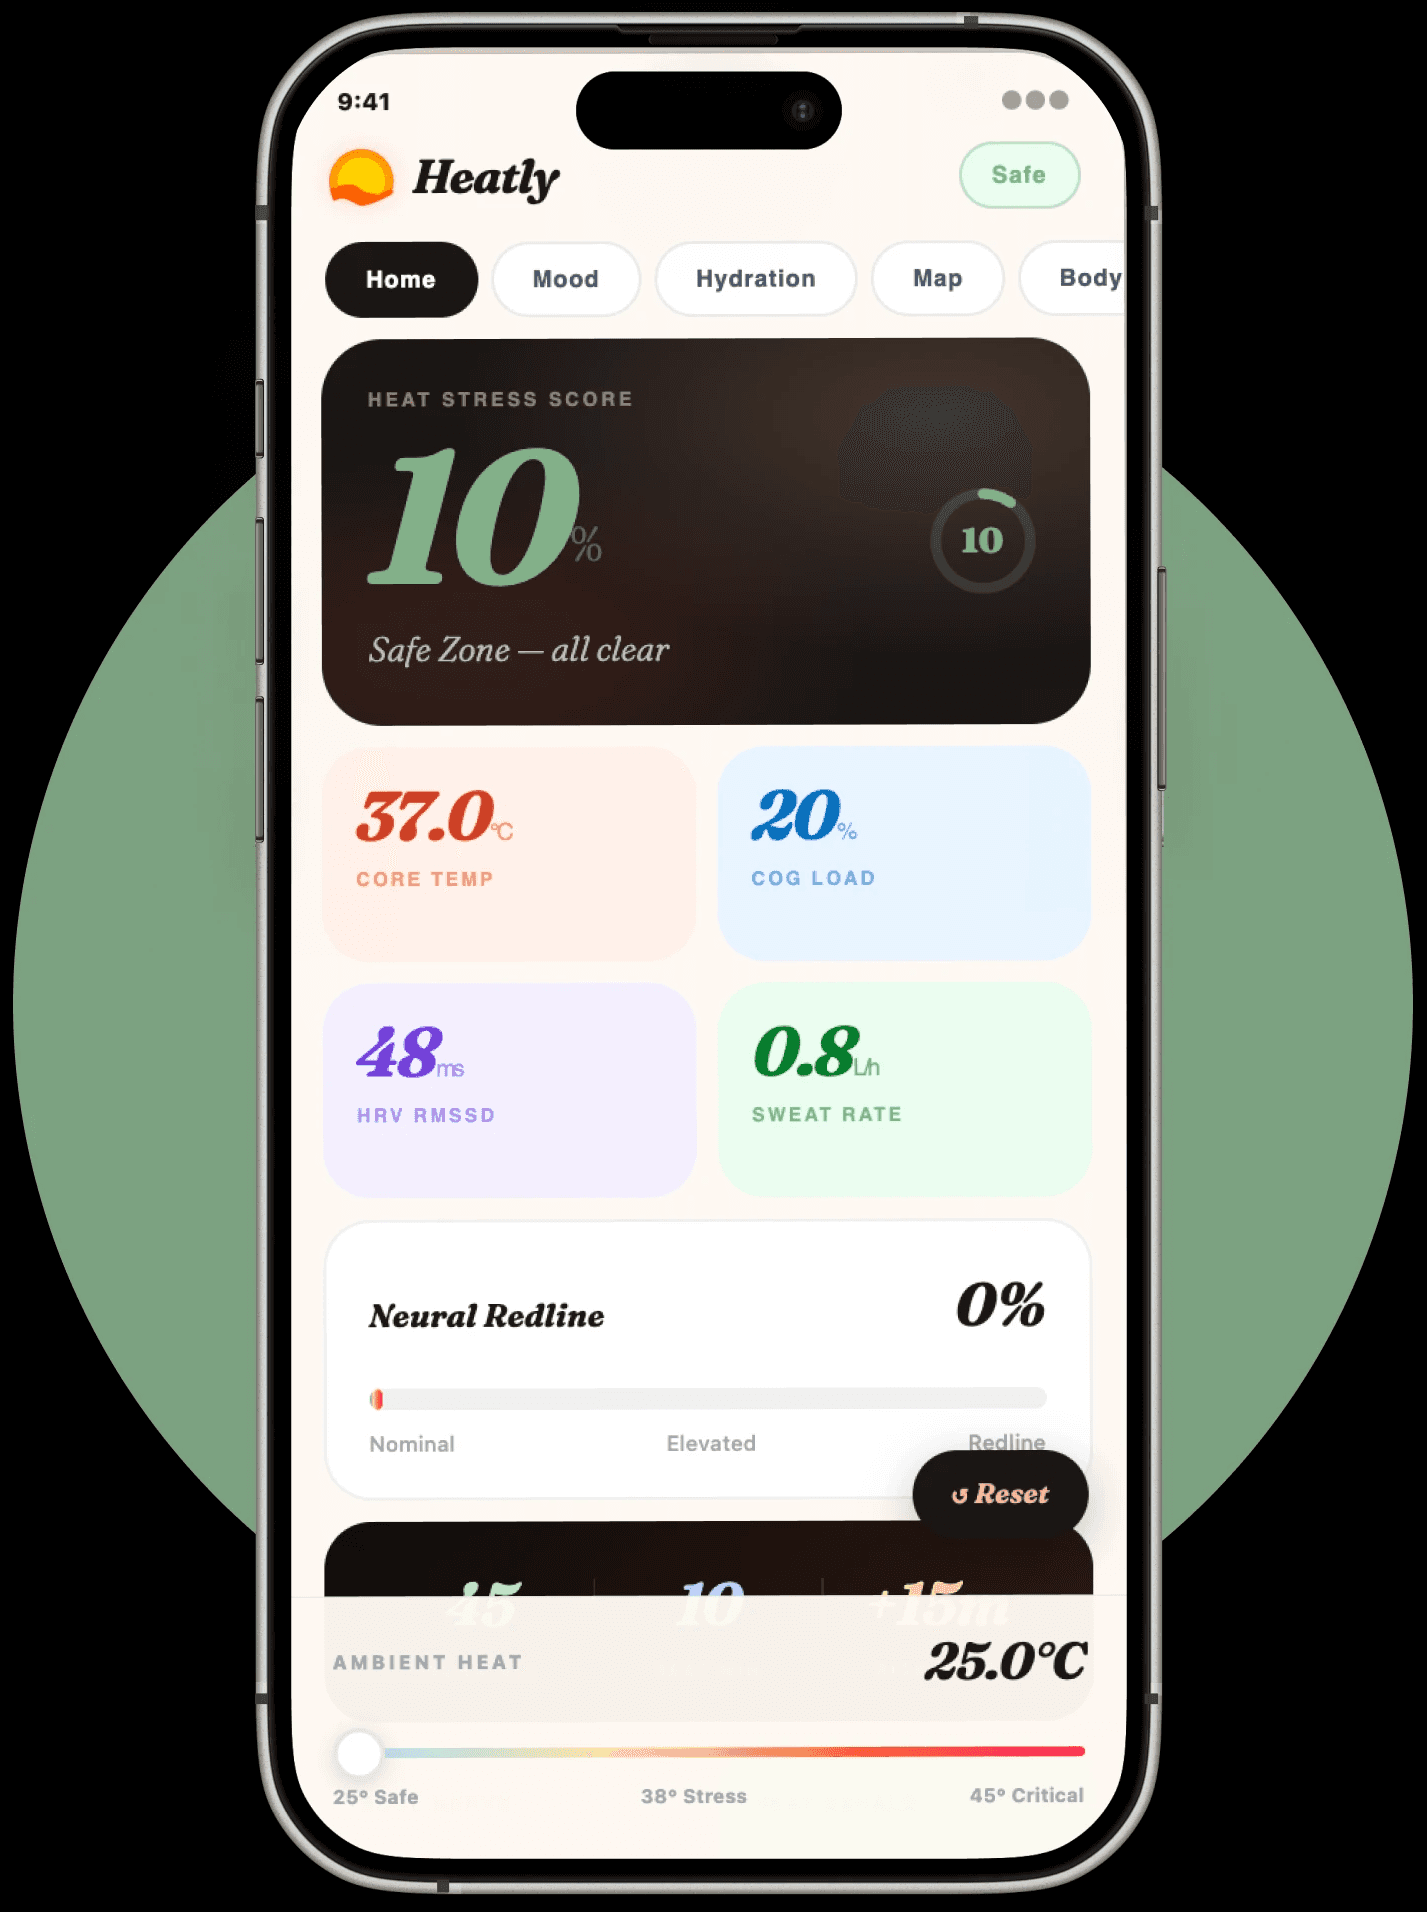
Visually understand how the heat is affecting you body
Reduce heat-related injuries for outdoor workers by making "invisible" biological signals, core temperature & hydration, visible and actionable.
Create a "glanceable" interface that provides high-utility data without distracting workers from their high-stakes tasks.
Imagine a future where non-invasive biometrics can accurately predict cognitive strain before a heat stroke occurs.
Log your mood
Measure how the heat could affect your mood and focus.
Know when your body is at a critical level.
Instant measurements and data determined by inputing your mood.
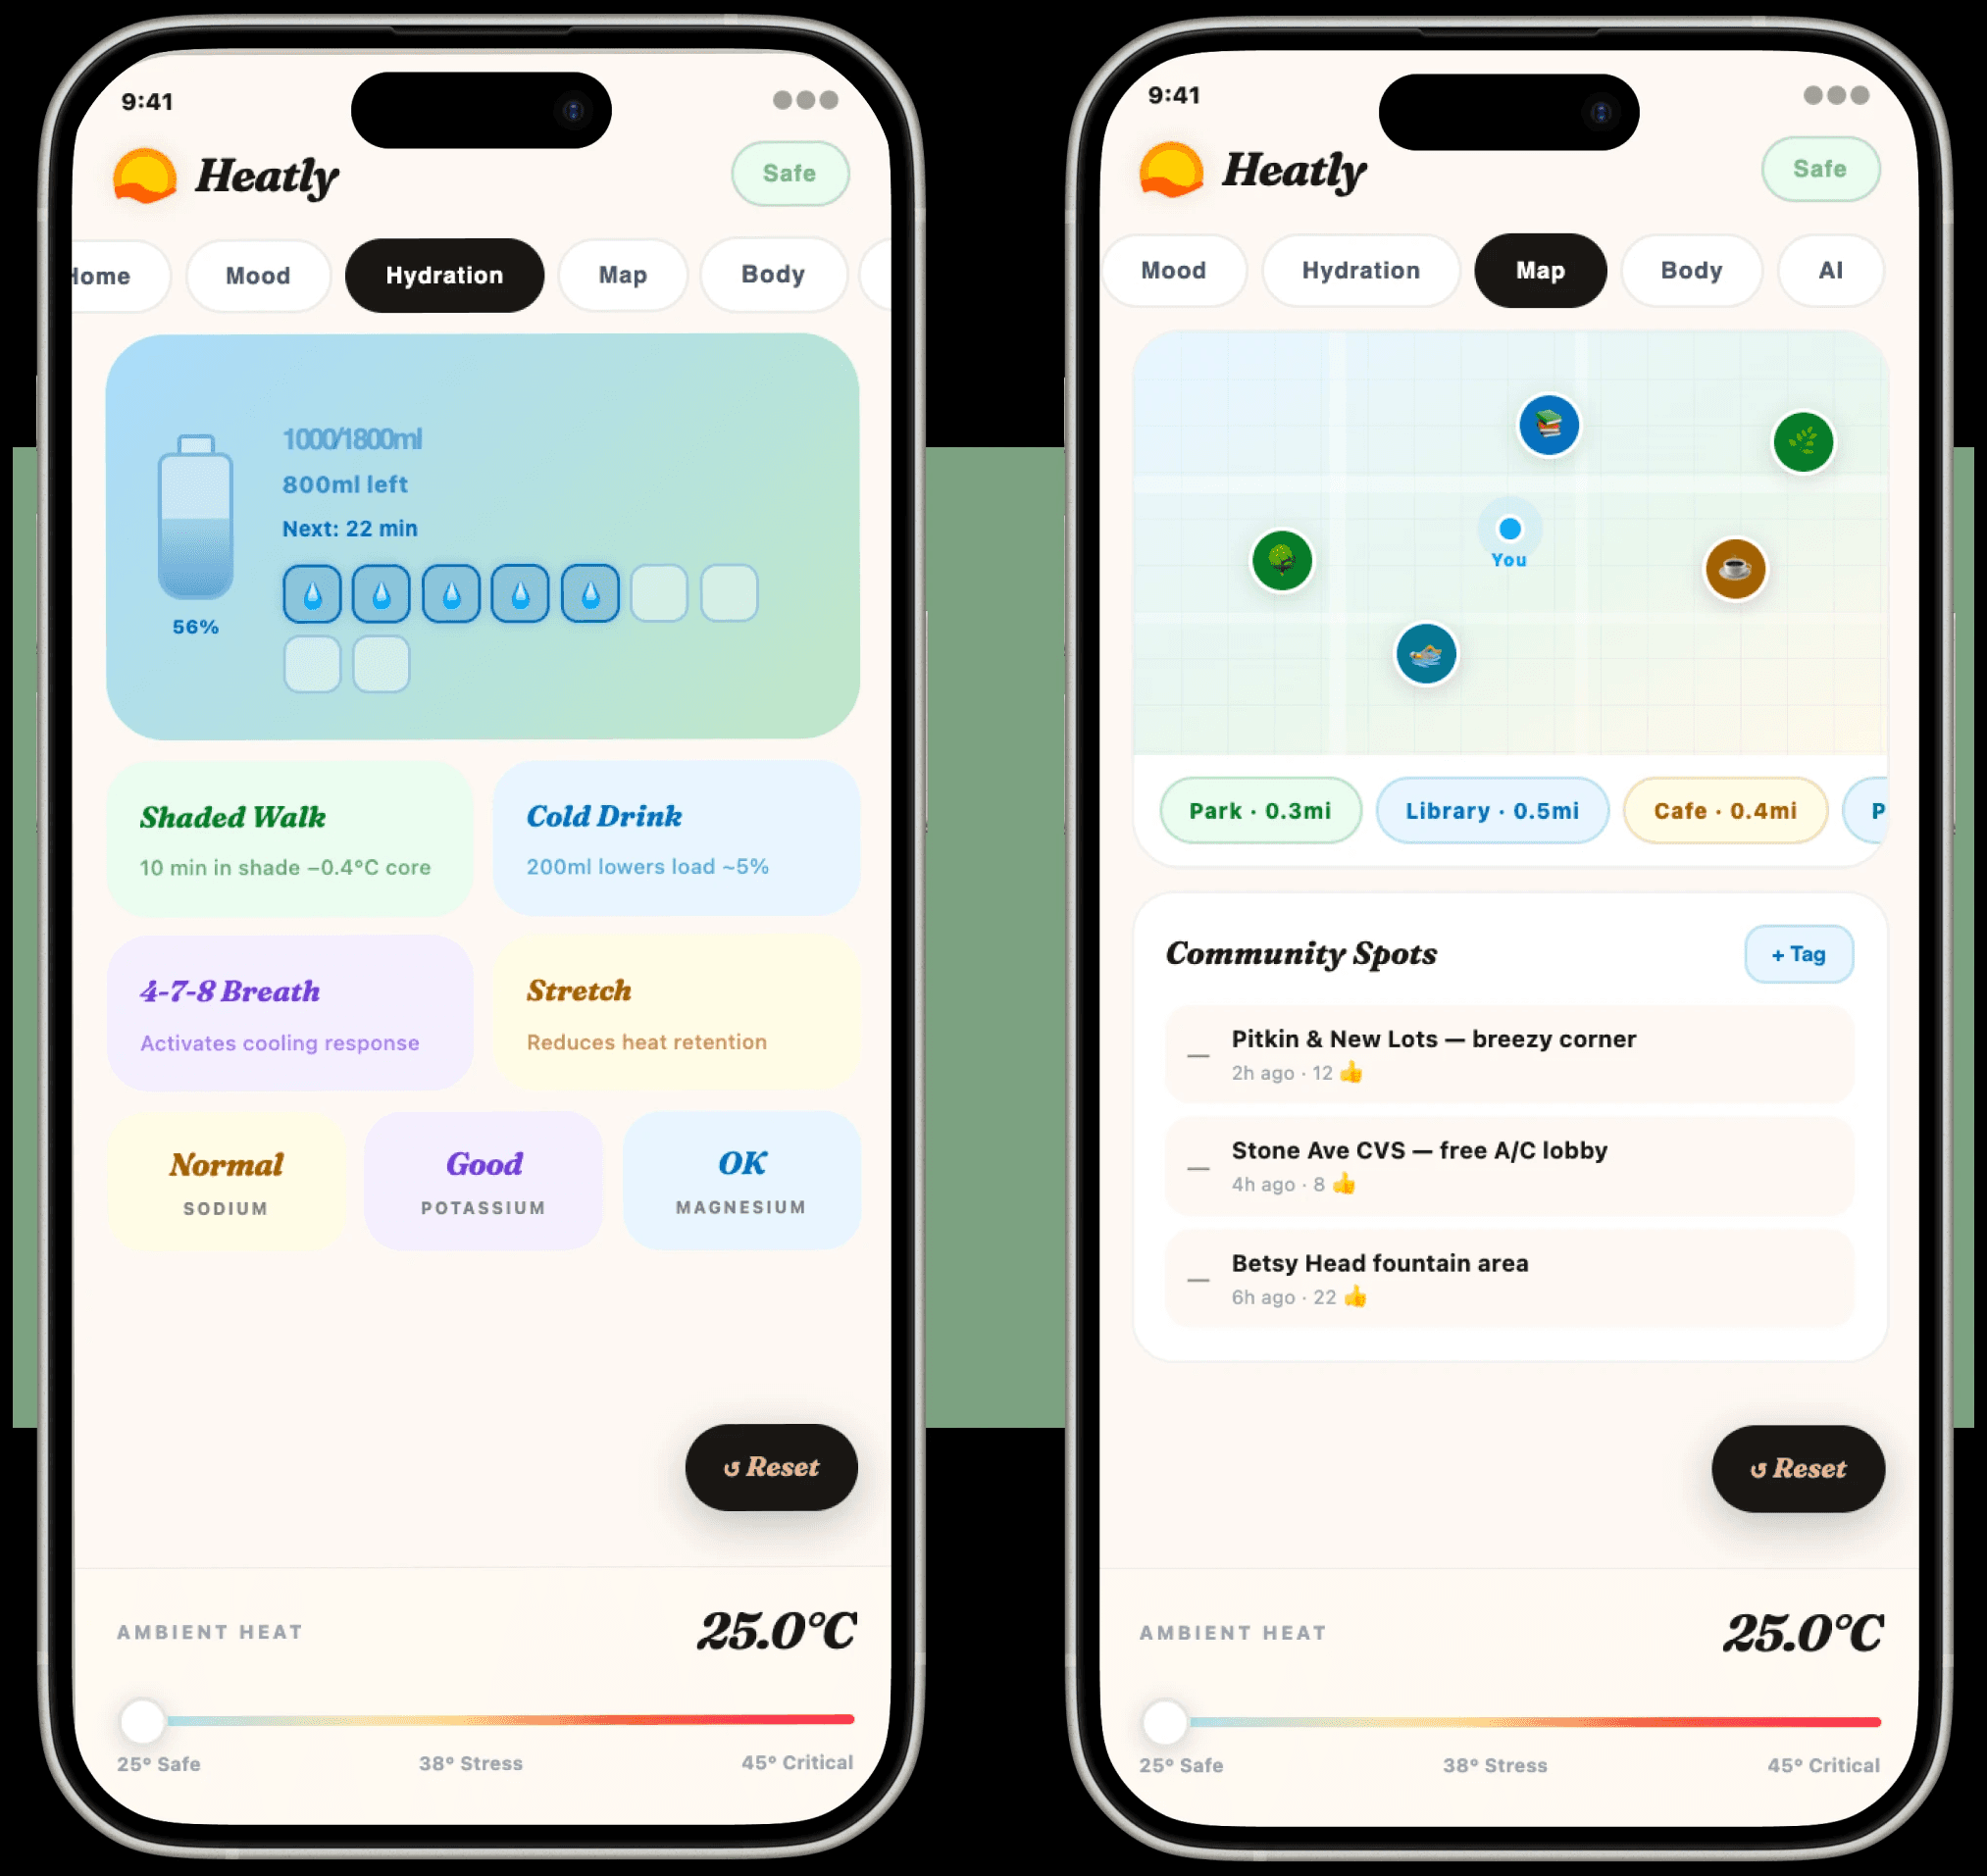
Record water intake and control temperature
Screens shift from cool blues to warning oranges/reds as a pre-attentive processing cue. The user knows their status before they even read a single word.
Reminders to drink water and cool down
Find nearest cool down area to take a break.
RESEARCH
User Needs and Competitive Analysis
We researched OSHA (Occupational Safety and Health Administration) heat standards and identified the "Danger Zone" temperatures for manual labor.
Competitor Research: We looked at current fitness trackers (Apple Fitness App, Apple Watch) and realized they focus on either just regular health data or athletic performance rather than occupational viability. This gap became our opportunity.
REFLECTION
Final Results
Heatly transforms the silent threat of heat stroke into a visible, manageable, experience. By leveraging technology, it quantifies previously unmeasurable human sensory experiences, core temperature, hydration levels, and cognitive strain, to empower outdoor workers in extreme heat.
Early prototypes and user testing showed:
Reduced heat-related injuries by making core temperature and hydration levels visible in real time, allowing workers to take preventive action before reaching critical thresholds.
Enhanced independence and confidence for outdoor workers, particularly those in high-risk environments, by providing a “glanceable” interface that delivers high-utility data without overwhelming them.
Improved focus and well-being through mood tracking, water intake reminders, and notifications to cool down, reducing the risk of cognitive strain and heat stroke.
Seamless integration into workflows with intuitive design, shifting from calming blues to warning oranges/reds as pre-attentive cues, ensuring users stay informed without losing focus on their tasks.